Tree Diagram
A Tree Diagram (also referred to as a systematic diagram) is a graphic tool which systematically breaks down all the details needed to complete a given objective or process. It is used to break down broad categories or complex processes into minute details allowing you to examine the finer details.
A tree diagram is a simple way of representing the hierarchical nature of a structure in a graphical form. It begins with a broad objective and narrows it down into specific tasks or options. The main broad objective has one or more branches leading out from it. Many of these branches will subdivide into more branches. The branches continue to map out all components or tasks of a process in increasing detail. The branches continue until all possibilities have been exhausted. When finished, it looks like a tree, with a trunk and multiple branches.
About a Tree Diagram
The tree diagram is similar to an organization chart or family tree diagram. It breaks down one broad topic into increasing levels of granularity. It is used to figure out all the tasks that must be completed to achieve a specific objective or complete a process. The end product will give you a better understanding of the scope of an objective or process.
The Process of Creating a Tree Diagram
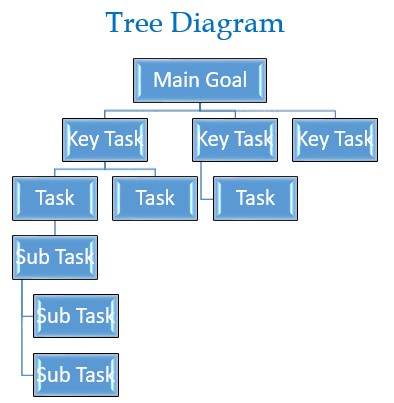
The process of creating a tree diagram begins with one central goal and then branches into additional tasks and keeps branching until all the sub-tasks necessary to achieve the objective are exhausted.
Creating a tree diagram helps in understanding a process by graphically breaking down complex processes to smaller levels of detail. This systematic breakdown also helps ensure smaller sub-task do not get forgotten.
Since it is a step-by-step process that moves from general to specific in a systematic way, it encourages you to direct your thinking from generalities to specifics.
Tree Diagram Procedure
- Develop a statement of the goal or project objective.
- Write the main goal or objective at the top (for a vertical tree) or far left (for a horizontal tree) of your flip chart, white board, or paper.
- Think of the key activities or tasks that must be completed in order to achieve the project goal.
- Branch these key activities or tasks off of the main goal. Your diagram should progress from general to more specific with each level.
- Think of the additional tasks that must be done in order for the objective to be achieved.
- Branch these tasks off of the key activities or tasks.
- Continue to create increasingly specific levels of the tree until all possibilities are exhausted.
Additional Links
Seven Management Planning Tools
Process Decision Program Chart