Activity Network Diagram
Activity Network Diagram (also referred to as an Arrow Diagram) is a tool used to map out activities and tasks for a project in sequential order. Basically, it graphically depicts a project timeline.
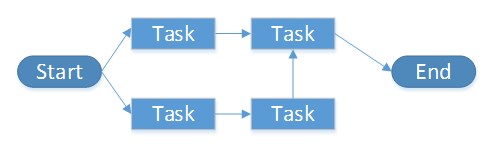
This tool displays interdependent relationships between activities, tasks, and groups as they all impact a project. Boxes and arrows are used to illustrate different activities and the links between them as well as chart the sequential order of the entire process.
About Activity Network Diagrams
An Activity Network Diagrams is a quality management tool that helps manage the development of projects by charting the flow of activity between individual tasks. It is essentially a diagram of project activities that shows the sequential relationships of activities using boxes and arrows.
Arrows pointing away from a task box go to the sequentially following task(s). Hence, arrows pointing into a task box come from its preceding task(s).
The overall diagram illustrates which tasks must be completed before the following task can begin. It also shows which tasks cannot start until at preceding task is complete.
An Activity Network Diagram graphically shows;
- the total amount of time needed to complete a project
- the sequence in which tasks must be completed
- interdependencies between tasks
- if multiple tasks can be carried out simultaneously
- which tasks are critical
The Process of Creating an Activity Network Diagram
Activity Network Diagram is used for identifying time sequences of events which are pivotal to your project objectives. The process of creating this diagram helps in understanding specific event sequences driving time requirements, thus enabling you to create a realistic project schedule. It also helps to find out the most efficient sequence of events needed to complete a project.
How to Create an Activity Network Diagram
- List all the tasks or activities that are required to complete the project.
- Identify each activity or task with a box.
- Determine the chronological order of the tasks or activities.
- Determine if any tasks can be completed simultaneously.
- Place (or draw) the tasks or activities boxes in chronological order. If tasks can be completed simultaneously, place them parallel to each other.
- Draw arrows depicting the sequence of the activities.
- If two or more activities need to be completed after a task, then have two or more arrows emerging from the activity box.
- Continue connecting activity boxes with arrows until the entire project sequence has been complete.
Additional Links
Seven Management Planning Tools
Process Decision Program Chart